Many products on this page are from partners who compensate us. This doesn't influence our ratings. Our opinions are our own.
How to Read Candlestick Charts
By Sophie Brown, Senior Finance Editor · Updated Jul 2026 · Fact-checked Jul 18, 2026
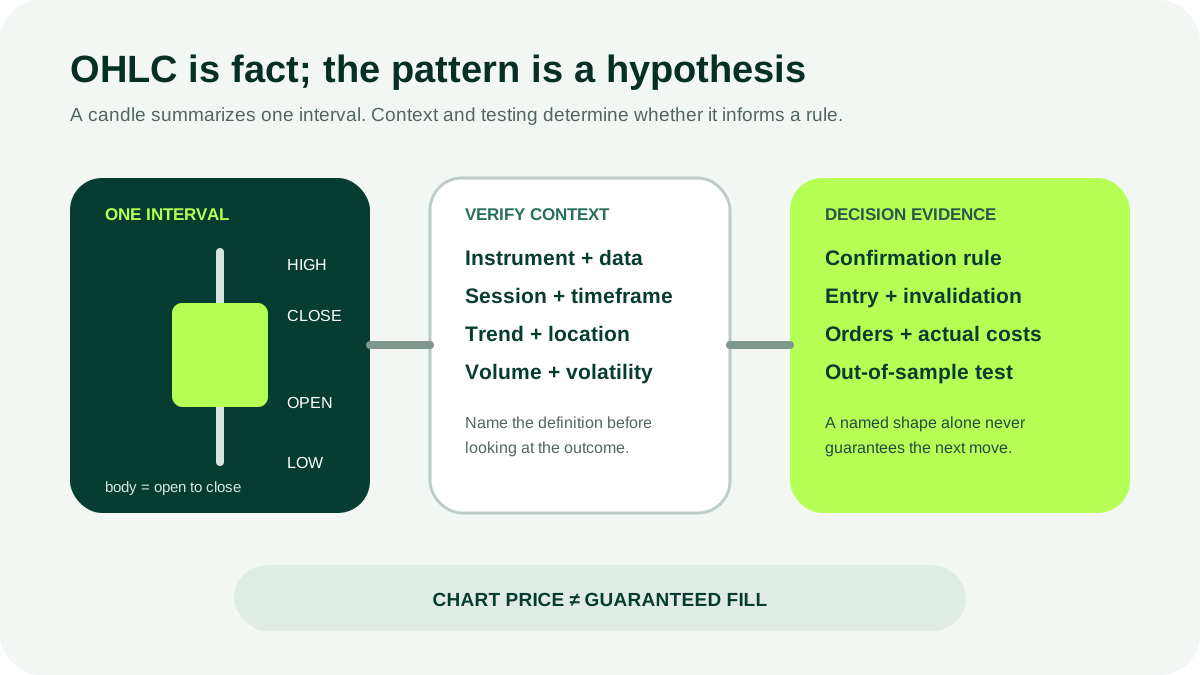
A candlestick compresses four observed prices—open, high, low, and close—into one selected interval. Its body shows the distance between open and close; its wicks show the interval’s extremes. That visual summary is useful, but a candle is not a self-validating trade signal. Reliable chart work starts by confirming the market, session, adjustment, timeframe, and data source, then adds trend, levels, volume, volatility, execution, and a properly tested rule.
Key takeaways
- Read every candle as open, high, low, and close for a specified instrument, session, interval, and data source.
- Color is only a platform convention; body and wick positions determine whether the close finished above or below the open.
- A named pattern without prior trend, location, volume, volatility, and confirmation is incomplete evidence.
- Charts record transactions and quotes; they do not reveal every participant’s motive or guarantee the next price.
- Backtest explicit rules with costs and out-of-sample data before using a chart observation in a trading decision.
Identify exactly what the chart represents
Before interpreting shape, read the chart header. Confirm the legal instrument, venue or consolidated feed, currency, price basis, session, corporate-action adjustment, timezone, and interval. A one-minute stock chart, a daily futures chart, and a weekly cryptocurrency chart can display similar candles while representing very different trading conditions.
Ask whether extended-hours transactions are included and whether daily bars use the regular-session close. For stocks, split- and dividend-adjusted history can differ from unadjusted transaction prices. For futures, a continuous contract can splice multiple expirations. For foreign exchange or crypto, data can vary by venue.
Read the four prices
Each candle contains:
- Open: first recorded trade for the interval under the chart’s rules;
- High: highest recorded trade during the interval;
- Low: lowest recorded trade during the interval;
- Close: final recorded trade for the interval.
The real body spans open to close. The upper wick extends from the higher body edge to the high; the lower wick extends from the lower body edge to the low. If close is above open, platforms commonly use green, white, or hollow styling. If close is below open, red, black, or filled styling is common. Always verify the legend because colors are configurable.
A long body indicates a large open-to-close move relative to that chart’s scale. A small body means open and close were close together. A long wick shows price traded farther from the body before the interval ended. These are observations, not explanations: a wick does not prove a particular group “rejected” price.
Match interpretation to timeframe and session
A five-minute candle summarizes five minutes; a daily candle may summarize only the regular session or nearly 24 hours, depending on product and platform. A pattern can appear on one timeframe and disappear when the data is aggregated differently.
Use at least two views:
- a higher timeframe to define the broader trend, range, and important levels;
- an execution timeframe to specify the proposed entry and invalidation.
Do not switch timeframes after a trade merely to find a more favorable story. Write the primary and confirmation intervals before reviewing the setup.
Establish trend and market structure
Describe price behavior without relying on a single indicator. An uptrend often consists of generally higher swing highs and lows; a downtrend generally has lower highs and lows; a range repeatedly rotates between boundaries. Real charts contain exceptions and overlapping structures, so define how many bars or pivots establish the condition.
Mark levels that existed before the current candle:
- prior session high, low, and close;
- recent swing highs and lows;
- gaps and consolidation boundaries;
- areas of repeated trading;
- event-related levels;
- round numbers only when evidence shows actual relevance.
A long lower wick near a preidentified support area conveys different information from the same shape in the middle of an unstructured range. Location should be specified before pattern classification.
Add range, volume, and volatility
Compare the candle’s total range and body with recent bars. A $1 range can be exceptional for a quiet $20 stock and ordinary for a volatile $500 stock. Normalizing by recent range or an explicit volatility measure makes comparisons more consistent.
Volume measures activity, not whether buyers or sellers “won”—every completed trade has both. Compare volume with the instrument’s normal level at the same time of day. The opening and closing minutes often have structurally different volume from midday.
Price can move on limited displayed liquidity, and consolidated volume may not capture identical information across products. Use volume as context rather than proof of intent.
Understand common candle descriptions
Pattern names can provide a shorthand if their definitions are explicit.
Doji and small-body candles
A doji has open and close at or very near the same price under a chosen tolerance. It shows little net open-to-close change, not guaranteed indecision and not an automatic reversal. In a quiet range it may be ordinary; after a large move at a defined level it may justify watching the next bar.
Hammer-shaped candles
A hammer description generally refers to a small body near the upper end of a candle with a long lower wick, often discussed after a decline. The identical geometry in another context can receive another name. Define the wick-to-body ratio, preceding trend, location, and confirmation rather than searching for a perfect illustration.
Engulfing candles
An engulfing body covers the prior candle’s body under the selected definition. Some definitions require strict inequalities, include wicks, or require opposite colors. Without a fixed definition, a backtest can be unconsciously adjusted to include winners and exclude losers.
Inside and outside bars
An inside bar has a range contained within the previous bar; an outside bar exceeds both the previous high and low. They describe compression or expansion relative to one bar. Neither specifies which boundary will break or whether an apparent breakout will persist.
Wait for confirmation without pretending it is certainty
Confirmation means an additional predefined condition, such as a close beyond a level, a following-bar break, sustained volume, or alignment with a higher-timeframe rule. It reduces some ambiguous cases but enters later and can worsen the price.
State the trade-off in the test. Do not label the next favorable move “confirmation” after seeing it. A candle is not final until its interval closes; an apparent pattern can change shape before then.
Translate a chart idea into an executable rule
A usable hypothesis includes:
| Component | Example of a precise definition |
|---|---|
| Universe | U.S. stocks above stated price and liquidity thresholds |
| Context | Daily uptrend under a fixed swing rule |
| Location | Pullback to a level identified before the signal bar |
| Candle | Lower wick at least twice body, close in top quarter of range |
| Entry | Limit or stop condition on the following session |
| Invalidation | Price level proving the setup wrong |
| Exit | Fixed time, target, trailing rule, or opposite condition |
| Risk | Maximum dollars and aggregate portfolio exposure |
This is an example of specification, not a recommended strategy. Small definition changes can materially alter results.
Understand order risk
The chart is not the fill. Market orders prioritize execution, while limit orders can remain unexecuted. Stop orders can fill far from the trigger in volatile markets, and stop-limit orders can fail to execute. A gap can move directly through a chart-based invalidation level.
Account for bid-ask spread, slippage, partial fills, trading halts, session eligibility, fees, market impact, and tax. Use bid and ask data when available rather than assuming every historical trade at the candle price was accessible.
Test without look-ahead bias
Write the rule before examining outcomes. Use data that would have been available at the decision time, including the fact that the signal candle must close before its final OHLC values are known.
Separate data into development and out-of-sample periods. Include delisted securities where relevant to reduce survivorship bias. Test across different volatility regimes and report number of trades, average result, loss distribution, maximum drawdown, time exposure, turnover, and results after realistic costs.
Avoid tuning many parameters to one dataset. If ten pattern variants are tested and only the best is reported, the result may be luck. Paper trading can test the operational process, but simulated fills and real-time psychology differ from live trading.
Build a repeatable chart checklist
For each observation, save:
- symbol and exact instrument;
- date, timezone, session, and interval;
- data source and adjustment setting;
- higher-timeframe condition;
- preexisting levels;
- candle OHLC, body, wick, and range measurements;
- volume and volatility comparison;
- rule-compliant entry, invalidation, and exit;
- estimated spread, slippage, and fees;
- result and whether every rule was followed.
Review all qualifying examples, not only screenshots selected after dramatic moves. The journal should make it possible to reproduce the decision from information available at the time.
Bottom line
Candlesticks are a compact visual language for open, high, low, and close. Read their anatomy accurately, verify the underlying data, and place each observation within timeframe, session, trend, location, volume, volatility, and execution context. A named candle becomes decision evidence only after its definition and complete trading rule survive honest testing with costs. It never guarantees the next move.
Related content
Frequently asked questions
Sources
Related content
More from DollarScout on this topic.
