Many products on this page are from partners who compensate us. This doesn't influence our ratings. Our opinions are our own.
Best Excel Formulas for Personal Finance
By Sophie Brown, Senior Finance Editor · Updated Jul 2026 · Fact-checked Jul 18, 2026
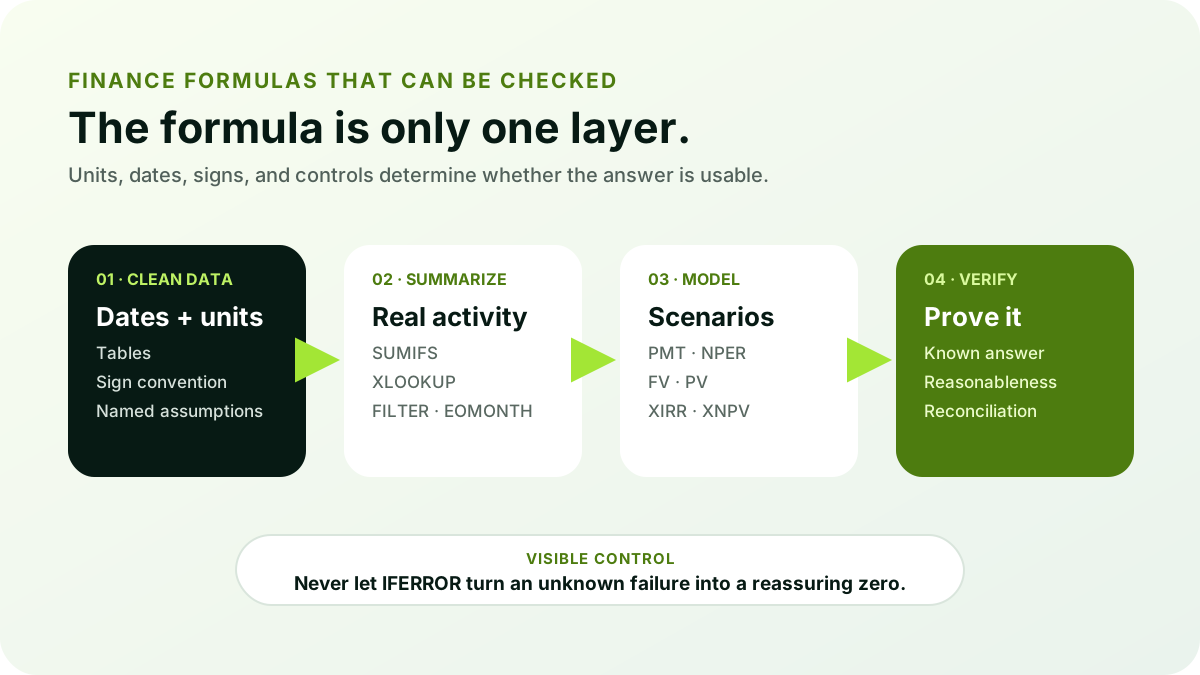
The best finance formula is not the most advanced one; it is the one whose dates, units, signs, and assumptions can be verified. This guide organizes 12 useful Excel formulas into budgeting, debt, saving, and return workflows, with copyable examples and checks that prevent a plausible-looking result from becoming a financial decision error.
Key takeaways
- Use SUMIFS, XLOOKUP, FILTER, and EOMONTH to organize real transaction data before attempting financial projections.
- For PMT, FV, and PV, the interest-rate period must match the payment and period count.
- Use XIRR rather than IRR when cash flows occur on irregular real-world dates.
- IFERROR should label an expected exception, not silently convert broken data to zero.
- Every important formula needs a known-answer test and an independent reconciliation or reasonableness check.
Formula choice comes after model design
Excel can calculate a wrong model perfectly. Before choosing a function, define the question, input unit, timing convention, sign convention, and expected result. A monthly loan calculation needs a monthly rate and number of monthly periods; an annual rate copied directly into that formula can produce a large but visually plausible error.
Microsoft’s formula guidance explains that formulas begin with an equal sign and combine functions, references, constants, and operators. Use references for assumptions that may change, and give those cells clear labels. Hard-coding an annual rate repeatedly inside formulas makes review and updates harder.
1. SUMIFS: total by category, account, or period
SUMIFS adds values that meet multiple criteria. With dates in A, categories in B, accounts in C, and signed amounts in D, a monthly grocery total can be:
=-SUMIFS($D:$D,$B:$B,"Groceries",$A:$A,">="&$H$1,$A:$A,"<"&EDATE($H$1,1))
Here H1 contains the first day of the month. The exclusive upper boundary avoids guessing the final day. Use real dates and a single sign convention. A manual filter and subtotal of a small sample should match the formula.
2. XLOOKUP: attach controlled attributes
XLOOKUP can retrieve the budget type, planned amount, or account owner associated with a category:
=XLOOKUP(B2,Categories[Category],Categories[Type],"Review")
The explicit Review result exposes unmapped categories. Returning an empty string would make missing mappings harder to notice. Exact matching is the safe default for category and account tables.
3. FILTER: show the rows that need action
Use FILTER to create a review queue without copying records:
=FILTER(Transactions,(Transactions[Category]="")+(Transactions[Cleared]="No"),"No rows to review")
This example returns uncategorized or uncleared items. Keep the source ledger authoritative and make corrections there, not inside the filtered output.
4. EOMONTH: create dependable period boundaries
EOMONTH returns the last day of a month. It is useful for statement dates, contribution schedules, and aging:
=EOMONTH(A2,0)
For a month-start key use =EOMONTH(A2,-1)+1. Do not group on formatted text such as “Jul 26” when a date value can preserve sorting and comparison behavior.
5. IF and IFERROR: make exceptions visible
IF can test a business rule, such as flagging spending over plan:
=IF([@Actual]>[@Planned],"Review","Within plan")
Use IFERROR only when the possible error is understood:
=IFERROR(XLOOKUP(B2,Categories[Category],Categories[Type]),"UNMAPPED")
Avoid IFERROR(formula,0) around financial calculations. Zero could mean no balance, no return, or no spending; it should not also mean a broken reference or missing price.
6. PMT: estimate a level payment
PMT calculates a periodic payment under constant-rate, constant-payment assumptions. If B2 contains a 7.2% annual rate, B3 contains 5 years, and B4 contains a $25,000 principal:
=-PMT(B2/12,B3*12,B4)
The minus sign displays the outgoing payment as positive because Excel’s financial functions use a cash-flow sign convention. This is an estimate, not a lender payoff quote. Fees, payment timing, variable rates, daily interest, and irregular payments can change actual results.
7. NPER: estimate periods to a target
NPER calculates how many equal periods a constant payment requires:
=NPER(APR/12,-MonthlyPayment,CurrentBalance,0)
If the payment does not cover accrued interest, the formula may fail or produce an unusable result. Add a warning that compares the proposed payment with a simple monthly-interest estimate, and reconcile projections with statements.
8. FV: project a savings balance
FV estimates future value with a constant periodic rate and payment:
=FV(AnnualReturn/12,Years*12,-MonthlyContribution,-StartingBalance)
The output is a scenario, not a promised investment result. Markets do not deliver a constant monthly return, taxes and fees may apply, and contribution dates matter. Test several conservative return assumptions rather than displaying one precise future number as a forecast.
9. PV: translate future cash flows into a present value
PV calculates the present value of constant periodic cash flows:
=-PV(DiscountRate/12,Years*12,MonthlyCashFlow)
The result depends heavily on the selected discount rate and on whether cash flows occur at the beginning or end of each period. Put the assumption next to the output and explain it. Present value is not market price and should not be used without considering uncertainty.
10. XIRR: measure irregular dated cash flows
IRR assumes periodic intervals. Personal investment deposits and withdrawals rarely occur on a perfect schedule, so XIRR is generally the better function when dates are available:
=XIRR(CashFlows[Amount],CashFlows[Date])
Use negative numbers for contributions and positive numbers for withdrawals or final value, from the investor’s perspective. The series needs at least one positive and one negative value. Multiple sign changes can create interpretation issues, and a result should be compared with independently calculated account performance.
11. XNPV: value irregular cash flows at a chosen rate
XNPV discounts dated cash flows:
=XNPV(DiscountRate,CashFlows[Amount],CashFlows[Date])
Document why the discount rate is appropriate and whether the first cash flow occurs on the valuation date. XNPV and XIRR answer different questions: XNPV uses a chosen required rate to calculate value, while XIRR solves for the rate that sets the dated cash flows’ net present value to zero.
12. LET: make complex formulas reviewable
LET assigns names to intermediate values. It can make a model easier to read and avoid recalculating the same expression:
=LET(monthlyRate,APR/12,periods,Years*12,-PMT(monthlyRate,periods,Principal))
Names such as monthlyRate and periods expose the unit conversion. A shorter formula is not automatically clearer; use LET when it reveals logic rather than compressing an already simple expression.
A practical formula map
| Financial question | Primary formula | Required control |
|---|---|---|
| How much did I spend? | SUMIFS | Reconcile transactions to statements |
| Which records need review? | FILTER | Count unresolved rows |
| What attribute belongs to this category? | XLOOKUP | Flag unmatched keys |
| What is a level loan payment? | PMT | Match rate and period units |
| How long at this payment? | NPER | Confirm payment exceeds interest |
| What could regular saving become? | FV | Show multiple assumptions |
| What is a series worth today? | PV or XNPV | Document discount rate and timing |
| What return did irregular cash flows imply? | XIRR | Verify signs, dates, and terminal value |
References, tables, and named assumptions
Convert transaction ranges to Excel Tables so new rows extend formulas and structured references automatically. Use names for a small number of central assumptions such as AnnualReturn, APR, or ValuationDate; avoid hundreds of opaque names.
Know when references move. A1 is relative, $A$1 is absolute, and mixed references lock only the row or column. Copy a formula across a test grid and inspect precedents before trusting it. Microsoft’s auditing commands, including trace precedents and evaluate formula, can help locate unexpected references.
Separate assumptions from outputs with visual and structural cues, but do not rely on color alone. Add units to labels: APR (annual), Term (years), Payment (monthly). A number named “Rate” or “Period” invites unit errors.
Validate every material result
For each important formula, create a small known-answer test. A 0% $1,200 balance repaid over 12 months should produce $100 monthly before fees. A SUMIFS test with three visible rows should match a manual sum. A lookup with a deliberately unknown category should show UNMAPPED.
Add reasonableness checks. Total categorized transaction amounts should equal total imported amounts. Ending cash should equal opening cash plus net transactions. Debt balances should move in the expected direction after interest and payments. Investment cash-flow dates should fall inside the evaluation period.
Preserve errors until they are understood. #N/A can reveal an unmapped category; #NUM! can reveal an impossible financial-function setup; #REF! can reveal a deleted dependency. Converting every error to a blank produces a clean dashboard and a weak model.
When formulas are not enough
For repeated imports and transformations, Microsoft’s Power Query can connect to external data, shape it, combine tables, load results, and refresh the process. That is useful for consistent bank CSVs or multi-account ledgers, but refresh is not verification. Confirm row counts, date ranges, duplicates, and totals after each import.
Do not place banking credentials or API secrets in workbook cells. Do not use a return formula as the sole basis for a trade, tax filing, loan decision, or regulated calculation. Excel is a flexible modeling tool, while statements, contracts, official tax records, and qualified advice remain authoritative for their respective purposes.
Bottom line
The most useful personal-finance functions are the ones that make raw records consistent, period totals reproducible, assumptions visible, and exceptions reviewable. Start with SUMIFS, XLOOKUP, FILTER, and real dates; add PMT, NPER, FV, PV, XIRR, or XNPV only after units and cash-flow signs are explicit. Then test the result against a known example and an independent control before acting on it.
Related content
Frequently asked questions
Sources
Related content
More from DollarScout on this topic.
