Many products on this page are from partners who compensate us. This doesn't influence our ratings. Our opinions are our own.
How to Research a Stock
By Sophie Brown, Senior Finance Editor · Updated Jul 2026 · Fact-checked Jul 18, 2026
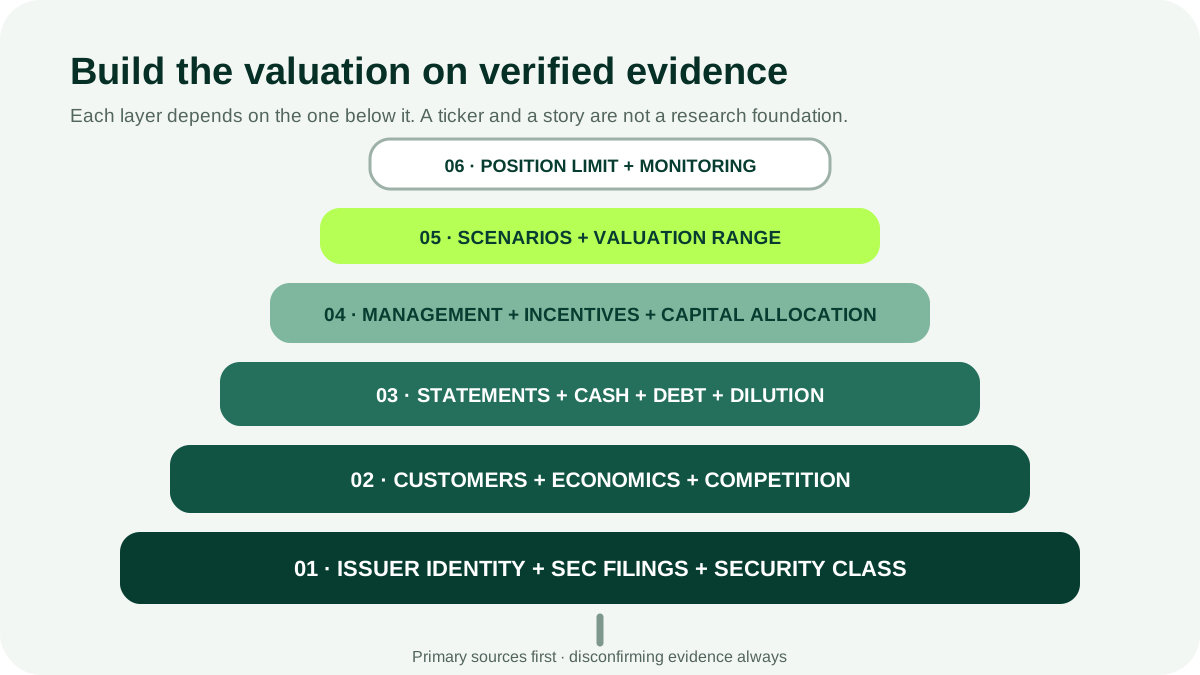
Stock research is the process of connecting a real business to its financial statements, incentives, risks, valuation, and portfolio role. It should begin with primary filings—not a ticker, influencer, rating, or target price. This guide builds a repeatable workflow from issuer verification and business economics through cash flow, debt, dilution, management, competitors, valuation scenarios, and ongoing monitoring.
Key takeaways
- Verify the legal issuer and read current 10-K, 10-Q, 8-K, proxy, and ownership filings in SEC EDGAR.
- Explain how the company earns cash before calculating ratios or accepting management’s adjusted metrics.
- Measure revenue quality, margins, cash conversion, reinvestment, leverage, dilution, and capital allocation across a full cycle.
- Value a range of scenarios and write disconfirming evidence; a great company can still be an overpriced stock.
- Limit position size and portfolio concentration because thorough research cannot remove company-specific risk.
Define the research question
Write what you are deciding: whether the company belongs on a watchlist, whether today’s price offers an acceptable long-term return, or whether an existing thesis remains intact. Add the expected holding period, maximum position size, required liquidity, and the role in the portfolio.
This prevents a common error: beginning with a price move and collecting only facts that justify it. Investor.gov recommends asking how an investment makes money, its risks, registration, liquidity, and fees. For an individual stock, the answer also requires understanding the issuer and the security class.
Verify the issuer and security
Search SEC EDGAR by company name, ticker, and Central Index Key. Match the legal name, exchange, and class of shares. Similar tickers, depositary receipts, tracking stocks, preferred shares, warrants, and foreign listings can represent different claims.
Investor.gov’s EDGAR guide explains the main forms:
- 10-K: audited annual statements, business, risk factors, and management discussion;
- 10-Q: unaudited quarterly statements, updates, and MD&A;
- 8-K: current material events and specified disclosures;
- DEF 14A: definitive proxy with votes, governance, executive pay, and ownership information;
- Forms 3, 4, and 5: insider ownership reports;
- 13D and 13G: certain beneficial ownership disclosures.
Check amendments marked /A, filing timeliness, auditor changes, restatements, and recent 8-K items. Foreign private issuers often use 20-F and 6-K. A company website is useful, but EDGAR is the public filing record.
Explain the business without valuation language
Describe the product or service, customer, purchase reason, pricing, delivery channel, supplier dependencies, and recurring capital needs. Break the company into segments and geographies.
Answer:
- Who pays, and what share of revenue comes from the largest customers?
- Is demand recurring, contractual, cyclical, discretionary, or regulated?
- What constrains supply or distribution?
- Can the company raise prices without losing volume?
- What makes a competitor’s offer better or cheaper?
- Which licenses, patents, networks, brands, data, or switching costs matter?
- What capital and working capital are needed for one more dollar of revenue?
A product you like is not automatically a durable business. A durable business is not automatically attractive at the current market value.
Read the 10-K in a purposeful order
The SEC’s 10-K guide describes standardized items. A productive order is:
- Business: products, segments, markets, regulation, seasonality, people, and competition.
- Risk factors: company-specific, industry, financing, legal, and market risks; compare changes with last year.
- MD&A: management’s explanation of results, liquidity, known trends, and critical judgments.
- Financial statements and notes: accounting policies, segment data, debt, leases, taxes, stock compensation, acquisitions, contingencies, and customers.
- Auditor report and controls: opinion, critical audit matters, and material weaknesses.
- Exhibits: material contracts, credit agreements, and organizational documents when relevant.
Search is useful, but do not read only keyword matches. Context, definitions, and cross-references matter.
Connect the financial statements
The SEC’s financial-statement guide explains that the income statement, balance sheet, cash-flow statement, equity statement, and notes work together.
Revenue and margin quality
Calculate multi-year revenue growth and segment mix. Separate organic growth from acquisitions, currency, and accounting changes. Track gross and operating margins through favorable and difficult periods.
Revenue can be reported before cash collection under applicable rules. Compare receivables, contract assets, deferred revenue, returns, and customer concentration. Rapid growth with worsening collection deserves investigation.
Cash conversion and reinvestment
Compare cumulative net income with cumulative operating cash flow across several years. Identify working-capital swings, stock compensation, deferred taxes, and other noncash items. Then examine capital expenditures, acquisitions, capitalized software, and finance leases.
Free cash flow is not a standardized GAAP line. Define it explicitly and avoid calling all investment optional. A factory, store, data center, vehicle fleet, or software platform may require recurring spending simply to remain competitive.
Balance-sheet resilience
List cash, debt, leases, pension obligations, purchase commitments, and major maturities. Compare interest expense with operating income and available cash with near-term obligations. Read covenants and whether debt is fixed or variable.
Goodwill and intangible assets can signal acquisition dependence and impairment risk. Off-balance-sheet or contingent commitments may appear in notes rather than headline debt.
Per-share economics
Track diluted weighted-average shares and period-end shares. Stock compensation, options, convertibles, acquisitions, and capital raises can dilute owners. Repurchases reduce shares only when they exceed issuance and settlement.
Use per-share revenue, profit, cash flow, and value where helpful. A company can grow total earnings while each share’s claim grows much more slowly.
Normalize without erasing real costs
Separate a genuinely unusual event from normal volatility, but preserve a reconciliation to GAAP. Common exclusions include stock compensation, restructuring, acquisition expense, amortization, litigation, and impairment.
Ask four questions:
- Did the cost require cash now or later?
- Does it recur despite a “one-time” label?
- Does excluding it improve comparability or merely the result?
- Does the valuation also exclude the assets or growth created by the cost?
Use a consistent definition across periods and peers. Company-defined adjusted EBITDA or free cash flow can be useful supplemental evidence, not a replacement for the statements.
Evaluate management and capital allocation
Read the proxy statement for incentive metrics, vesting, peer groups, ownership, related-party transactions, and board structure. Compare compensation targets with the outcomes that matter to long-term owners. Revenue growth incentives can encourage acquisition or discounting if cash return and per-share value are absent.
Review capital allocation over at least five years:
| Use of cash | Evidence to examine |
|---|---|
| Reinvestment | Returns, capacity, product outcomes, and capital intensity |
| Acquisitions | Price, financing, integration, goodwill, and later impairment |
| Debt | Maturity, rate, covenant capacity, and purpose |
| Repurchases | Price paid, shares actually retired, and offsetting issuance |
| Dividends | Coverage, durability, and competing capital needs |
Management interviews and earnings calls reveal explanations; filings and outcomes test them. Track promises against later results.
Compare competitors with matched definitions
Select companies serving similar customers with comparable economics. Market-cap size or a shared sector label is not enough. Compare growth, margins, capital needs, leverage, dilution, retention, and return on invested capital using consistent periods and accounting definitions.
Industry sources can add context, but document their incentives and methodology. A market-size forecast commissioned by a vendor is not equivalent to realized revenue. Look for regulation, government data, customer filings, supplier disclosures, and competitor statements that independently test the thesis.
Build a valuation range
Choose methods that match the economics:
- discounted cash flow for businesses where cash generation can be modeled;
- earnings or cash-flow multiples for mature comparable operations;
- enterprise-value multiples when capital structures differ;
- asset or sum-of-parts analysis where distinct assets or segments matter.
Use bear, base, and bull cases. State revenue growth, margin, reinvestment, tax, dilution, discount rate, and terminal assumptions. Reverse the current price into the performance it implies. If the market price requires a result outside plausible operating capacity, the risk is visible even when the story is attractive.
A P/E comparison is incomplete if earnings are cyclical, negative, unusually taxed, or financed with different debt. Enterprise value helps incorporate debt and cash, but EBITDA still omits capital needs. No single multiple is sufficient.
Write the thesis and disconfirming case
A useful one-page thesis contains:
- why customers choose the product;
- what creates or destroys economic advantage;
- the key financial drivers;
- management and capital-allocation evidence;
- valuation range and expected return drivers;
- principal risks and what the market may already price;
- three to five measurable disconfirming signals;
- next filing or event to review.
Write the bear case as strongly as the bull case. Seek evidence that would change your mind, not merely risks that sound possible. A risk section copied from the 10-K without probability, exposure, or monitoring is not a decision tool.
Fit the stock into the portfolio
Research quality does not eliminate fraud, litigation, product failure, financing stress, regulation, or unexpected competition. Cap the position based on risk capacity, liquidity, and correlation with existing holdings. Consider employer stock, sector funds, and suppliers that create hidden concentration.
Decide how to enter and rebalance without assuming the research identifies the lowest price. Avoid borrowing or using essential short-term funds for a concentrated equity position.
Monitor facts, not the ticker alone
Create alerts for new filings and a quarterly checklist. Update revenue drivers, margins, cash, debt, shares, guidance, risks, and valuation using the same definitions. Read 8-K filings between earnings dates.
Potential sell reasons include a broken thesis, unreliable reporting, unacceptable concentration, a better after-tax opportunity, changed financial goals, or a price that requires implausible outcomes. A decline below purchase price is not proof the thesis is wrong; getting back to the purchase price is not proof it is right.
Bottom line
Research a stock from issuer identity to portfolio fit. Use primary filings, connect business claims to all financial statements, inspect incentives and dilution, compare matched competitors, and value scenarios with explicit disconfirming evidence. The output is a decision under uncertainty—not a prediction or a guarantee.
Related content
Frequently asked questions
Sources
Related content
More from DollarScout on this topic.
