Many products on this page are from partners who compensate us. This doesn't influence our ratings. Our opinions are our own.
Fundamental vs. Technical Analysis
By Sophie Brown, Senior Finance Editor · Updated Jul 2026 · Fact-checked Jul 18, 2026
Fundamental analysis studies a business, its financial condition, competitive position, and valuation. Technical analysis studies market data such as price, volume, trend, and volatility. The methods are not rival formulas for certainty: they use different evidence, operate over different horizons, and fail in different ways. This guide shows what each method can and cannot answer, how to keep the data aligned, and how to build a written decision process instead of collecting indicators after the fact.
Key takeaways
- Fundamental analysis asks what could drive long-term business value; technical analysis asks what price and volume behavior says about the market now.
- A strong company can be a poor purchase at an extreme price, and a strong chart can reverse without warning.
- Use primary filings for business facts and split-adjusted, timestamped market data for technical tests.
- Combining methods only adds value when each has a defined job, horizon, entry rule, exit rule, and risk limit.
- Backtests, valuation models, and chart patterns are conditional tools—not guarantees or substitutes for diversification.
Start with the decision, not the method
Before opening a filing or chart, write down the decision: researching a five-year holding, choosing an entry for an approved company, managing an existing position, or testing a short-term trading rule. The holding period determines which evidence can matter.
Fundamental analysis is usually better suited to questions about revenue durability, margins, capital needs, debt, management, competitive advantage, and the price paid for expected cash generation. Technical analysis is usually better suited to questions about trend, trading range, volatility, liquidity, and execution. Neither method reveals the future.
What fundamental analysis examines
Fundamental work begins with how the company makes money. Identify customers, products, pricing power, major costs, geographic exposure, competitors, regulation, and the capital required to grow. Then connect that model to audited and interim financial statements.
For a U.S. public company, EDGAR is the primary record. The latest 10-K normally contains audited annual statements, business description, risk factors, management discussion, and notes. A 10-Q updates quarterly results and material risks. An 8-K reports specified current events. The proxy statement can disclose executive incentives, ownership, related-party matters, and governance.
Core questions include:
- Is revenue growth coming from price, volume, acquisitions, or accounting changes?
- Are gross and operating margins durable or cyclical?
- Does reported profit convert into operating cash over time?
- How much capital expenditure is needed to maintain the business?
- Can cash and credit capacity cover debt maturities and obligations?
- Are share issuance and stock compensation diluting each owner?
- Which assumptions explain the valuation at today’s price?
Fundamental analysis is forward-looking even when it uses historical numbers. A discounted cash-flow model, earnings multiple, or asset value is only as credible as the assumptions behind it. Use ranges and scenarios rather than a single “fair value.”
What technical analysis examines
Technical analysis works from market behavior. Common inputs include price, volume, volatility, moving averages, relative strength, gaps, support or resistance zones, and market breadth. FINRA describes technical indicators in momentum strategies as measures based on price, volume, or open interest used to assess whether momentum may continue.
The data needs discipline. Confirm whether prices are adjusted for splits and distributions, whether the strategy acts at the close or next open, and whether volume is consolidated. A chart can silently mix information that was not available at the decision time.
Technical evidence can help describe:
- whether price is trending or ranging;
- whether moves are occurring with unusual volume;
- how volatile the security has recently been;
- where an order may encounter limited liquidity;
- whether a prewritten entry, stop, or exit condition has triggered.
It cannot prove intrinsic value, management quality, solvency, or the truth of a corporate claim. A breakout immediately before an earnings release still carries event risk. A stop order controls an instruction, not the execution price during a gap.
Compare the methods directly
| Dimension | Fundamental analysis | Technical analysis |
|---|---|---|
| Main evidence | Filings, statements, industry data, management record | Price, volume, volatility, trend, breadth |
| Typical question | What economics and valuation could support a return? | What is the market doing and how will the rule execute? |
| Common horizon | Quarters to years | Intraday to months, depending on rule |
| Main output | Thesis, scenarios, valuation range | Signal, setup, entry, exit, position rule |
| Common failure | Bad forecasts, accounting blind spots, value traps | False signals, overfitting, gaps, regime change |
| Essential control | Thesis review and valuation margin | Tested rules, position sizing, execution limits |
The table describes tendencies, not laws. Fundamental investors may monitor price behavior, and systematic technical strategies may hold for months. The important distinction is the evidence used and the claim it supports.
Keep time horizons consistent
A quarterly margin thesis and a five-minute chart do not confirm one another. If the investment thesis needs three years to develop, a one-week price decline does not automatically refute it. If a trading setup depends on a two-day breakout, a ten-year market opportunity does not repair a failed stop.
Write the thesis horizon, expected milestones, and invalidation conditions. For a fundamental position, invalidation might include lost customers, deteriorating unit economics, excessive leverage, unreliable reporting, or a valuation that no longer offers an acceptable scenario. For a technical position, it might be a close below a defined level, loss of momentum, volatility expansion, or time expiration.
Build a fundamental workflow
1. Verify identity and filings
Match the legal issuer, ticker, exchange, and Central Index Key in EDGAR. Check amendments and late filings. Foreign issuers and funds use different forms.
2. Explain the business in plain language
Map products, customers, revenue model, cost structure, suppliers, competitors, and regulation. If the profit engine cannot be explained, a precise valuation is premature.
3. Read statements together
The income statement reports performance over a period; the balance sheet reports financial position at a date; the cash-flow statement reconciles cash changes; the equity statement shows changes in owners’ claims. Read the notes and accounting policies.
4. Normalize and compare
Separate recurring economics from unusual items, but do not simply accept management’s “adjusted” result. Reconcile non-GAAP measures to GAAP, inspect recurring exclusions, and keep stock compensation, restructuring, and acquisition costs visible.
5. Value scenarios and identify disconfirming evidence
Create bear, base, and bull cases with explicit growth, margin, reinvestment, dilution, and valuation assumptions. Write what evidence would prove the preferred case wrong.
Build a technical workflow
1. Define the universe and data
State eligible securities, liquidity minimums, data vendor, adjustment method, time zone, and trading hours. Excluding failed or delisted securities can create survivorship bias.
2. Define the signal mathematically
“Strong chart” is not reproducible. Specify lookback windows, calculation, threshold, entry timing, and any market filter. Freeze the rule before reviewing the result.
3. Include realistic friction
Backtests need commissions, spread, slippage, market impact, borrow cost where relevant, dividends, corporate actions, and taxes where the comparison is after tax. Avoid using future information or revised data.
4. Test beyond the development sample
Separate training and out-of-sample periods. Examine different market regimes and many securities. A complex rule can fit noise perfectly and fail immediately.
5. Predefine risk and execution
Set maximum position size, portfolio exposure, order type, loss rule, time exit, and behavior during halts or gaps. A signal without a loss process is incomplete.
Combine methods without double-counting
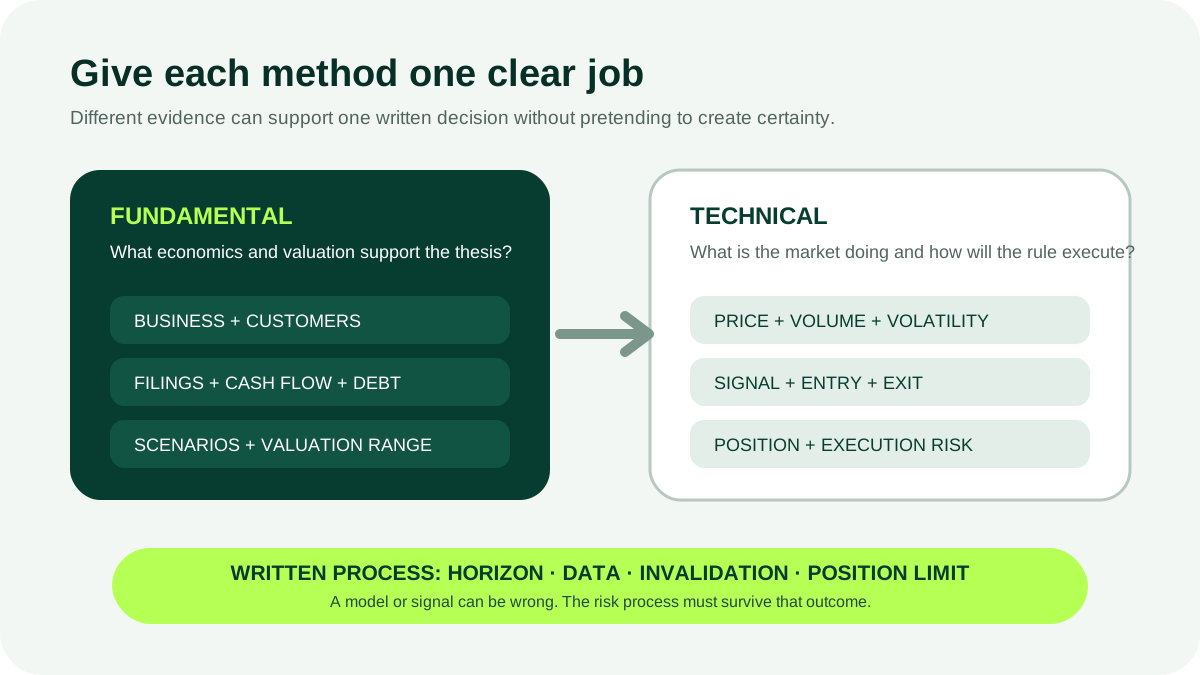
A coherent combined process can use fundamentals as a selection filter and technicals as an execution layer. Example:
- Fundamental criteria create an eligible list of financially sound businesses trading within a valuation range.
- A technical rule defines when to enter, how large the initial position is, and when price action invalidates the setup.
- Fundamental events trigger thesis review; technical triggers manage execution without rewriting the thesis.
The methods should not be counted as two independent votes when both rely on the same market story. Rising earnings estimates, a higher valuation, and price momentum can all reflect one crowded expectation. Correlation between signals reduces the apparent confirmation.
Another valid approach is to use no technical signal at all: buy a diversified allocation on a schedule and rebalance. FINRA warns that market timing requires repeated decisions and can miss recoveries. More analysis is not automatically a better household portfolio.
Recognize failure modes
Fundamental analysts can anchor to management guidance, treat a low multiple as proof of value, underestimate debt, ignore dilution, or move valuation assumptions to defend a favorite company. Technical analysts can see patterns after outcomes, optimize too many parameters, ignore trading costs, or abandon a tested rule after normal losses.
Both methods are vulnerable to confirmation bias, stale data, concentrated positions, and social-media narratives. Maintain a decision journal with the data available, rule, expected outcome, risks, and reason for any change. Review the process, not only whether the trade made money.
Bottom line
Fundamental analysis evaluates business economics and valuation; technical analysis evaluates market behavior and execution. Choose the method that matches the decision and horizon, use verifiable data, define invalidation before investing, and size risk so one wrong model or false signal cannot damage the plan. A disciplined combination can be useful, but neither method produces certainty.
Related content
Frequently asked questions
Sources
Related content
More from DollarScout on this topic.
