
Simply Wall St at a glance
Simply Wall St turns normalized company data into visual reports. Its signature snowflake summarizes five broad lenses—valuation, future growth, past performance, financial health, and dividends—while the full report expands into ownership, management, risks, price history, forecasts, and company updates. The interface is built for long-term equity research rather than live trading.
The service has three tiers. The Free plan allows five company reports per month, one portfolio with ten holdings, and limited screening. Premium raises the allowance to 30 company reports per month, three portfolios with 30 holdings each, three saved screeners, and brokerage linking. Unlimited removes the company-report and holding limits, allows five portfolios and ten saved screeners, and adds PDF/Excel export. Official Simply Wall St comparison pages list Premium at $120 per year and Unlimited at $240 per year; the checkout page remains the final source for currency, tax, and offer-specific price.
| Review question | DollarScout finding |
|---|---|
| Best for | Visual learners researching global listed companies and portfolios |
| Poor fit for | Bond, fund, crypto, or intraday-market research |
| Paid pricing checked | Premium $120/year; Unlimited $240/year |
| Main strength | Complex fundamentals organized into a fast visual workflow |
| Main limitation | Model outputs can appear more precise than their assumptions justify |
What the snowflake actually tells you
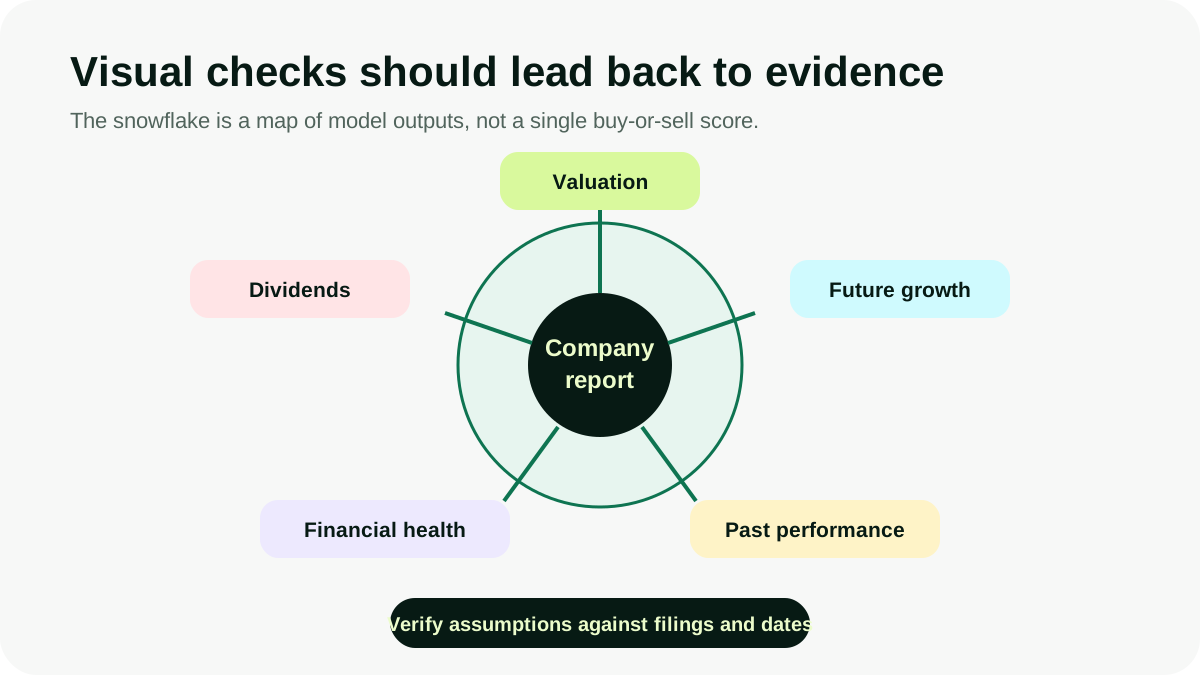
The snowflake is a compact representation of underlying checks, not a recommendation score. A large valuation arm can reflect passes on discounted-cash-flow or relative-valuation tests; a large financial-health arm can reflect liquidity and leverage checks; a dividend arm can reflect yield, coverage, stability, or expected growth. Two companies can have similarly shaped snowflakes for very different reasons.
The right interaction is to click through. Ask which checks passed, what threshold was used, which accounting period supplied the data, and whether an analyst forecast was available. Simply Wall St documents its methods in unusually useful detail. For example, the valuation section distinguishes intrinsic valuation, relative valuation, and analyst targets rather than pretending they are interchangeable.
Ease of Use earns 4.8/5 because the visual hierarchy makes a large report approachable. Color, charts, plain-language checks, and consistent sections help a reader find the important questions quickly. The deduction reflects the risk of superficial reading: scanning the snowflake without opening the detail can create false confidence, particularly when one arm depends on a small number of forecasts.
Data sources and update timing
Simply Wall St says its financial data comes from S&P Global Market Intelligence. The provider collects fundamentals, management and governance information, market prices, historical financials, ownership data, and broker estimates from regulatory filings, exchanges, company sources, and contributor networks. Simply Wall St then computes industry and market averages and applies its analysis model.
The company generally uses trailing-twelve-month data to improve comparability and reduce seasonality. That can explain why revenue, earnings, or valuation ratios differ from a site showing the last fiscal year or a single quarter. The data-source documentation also says consensus estimates are built from qualified analyst contributions on a consistent accounting basis.
Update speed depends on the field. Official help documentation says share prices are end-of-day and may take up to six hours to process; English financial statements typically appear one to three days after collection, while non-English statements can take longer; consensus estimate changes generally arrive within 24 to 48 hours and then process in a batch. Management, ownership, and insider data follow their own schedules.
Data Quality scores 4.1/5. S&P Global is a serious normalized source, the methodology is documented, and the product exposes data and model context. The score stops there because estimates remain estimates, end-of-day prices are not live, company coverage and analyst depth vary, and normalization can differ from the exact line items in an issuer filing. The last verification step should always be the company’s current regulatory disclosure.
How Simply Wall St estimates fair value
The valuation documentation describes four intrinsic models selected according to company type and available data: a two-stage discounted-cash-flow model, a dividend-discount model, an excess-returns model for financial businesses, and an adjusted-funds-from-operations model for REITs. The standard two-stage approach projects cash flow over a high-growth period, lets growth converge toward a long-run rate, calculates terminal value, and discounts the result to present value.
That framework is economically coherent, but small input changes can move fair value substantially. A higher discount rate reduces present value. A lower terminal growth rate can sharply reduce terminal value. Forecast cash flow may rely on analyst consensus, historical extrapolation, or model assumptions depending on coverage. The displayed dollar estimate should therefore be read as the output of a scenario—not as a target guaranteed by the platform.
The product also includes relative valuation and analyst price targets. Those answer different questions. A share can appear inexpensive relative to peers while still exceeding a conservative DCF value; analysts can agree on a target built from assumptions that later change. A good workflow compares the methods, notes why they disagree, and tests a range rather than anchoring on the most favorable number.
Plans and feature limits
The Free tier is a genuine way to inspect the interface, but five reports per month and one ten-holding portfolio constrain repeated research. It can suit someone evaluating a few companies or learning the structure before paying. Premium is the practical middle tier: 30 reports per month, three portfolios, 30 holdings per portfolio, three saved screeners, and broker linking cover many individual-investor workflows.
Unlimited is primarily a capacity and export upgrade. It removes company-report limits, allows unlimited holdings across five portfolios, increases saved screeners to ten, and unlocks PDF and Excel export. Those benefits matter to an investor researching a broad global universe or maintaining several substantial portfolios. They are difficult to justify merely to remove a limit a user never reaches.
Value receives 4.2/5. At the official $120 annual Premium and $240 annual Unlimited reference prices, the service is competitive with many U.S.-focused research subscriptions and unusually accessible for global equities. Value falls if the investor needs funds, fixed income, crypto, real-time prices, or deep qualitative analyst reports—features that require another product.
Pricing can vary by location, tax, store, and promotion. Simply Wall St’s terms allow pricing changes with reasonable notice. They also say discounted rates last only for the stated promotional period, after which the subscription reverts to the standard rate in effect. Confirm the amount and currency on the final checkout screen.
Portfolio tracking and broker linking
Portfolios can be built manually or connected to a supported brokerage on paid plans. Transactional portfolios can calculate realized and unrealized returns, dividends, currency effects, and internal-rate-of-return measures when the transaction history is complete. Holdings-only portfolios are quicker to create but provide a less exact performance history because they start from current positions or average cost.
The platform says broker linking uses SnapTrade and official brokerage APIs, with availability varying by broker and country. Simply Wall St says it does not store brokerage credentials. Even so, linking a financial account is a security and privacy decision. Review the connector permissions, use a unique password and multifactor authentication, and decide whether automatic synchronization is worth sharing account data with another service.
Portfolio outputs depend on inputs. Missing transactions, corporate actions, transfers, taxes, fees, or cash flows can make platform performance differ from a broker statement. Reconcile totals before using the charts to judge strategy. A beautifully rendered return curve is still wrong if the imported history is incomplete.
Coverage: broad geographically, narrow by asset type
Coverage earns 4.2/5. Simply Wall St documents access to listed companies across major global exchanges and supports REITs. The standardized report makes cross-market exploration easier than many domestic-only research tools, and global access is available across all plan levels.
The limitation is asset class. Official help material says the platform is largely equity-focused and does not cover mutual funds, bonds and other fixed-income securities, or cryptocurrencies. ETF support is not equivalent to full fund research. Investors building a multi-asset portfolio will need another source for bond characteristics, fund costs, tax treatment, and portfolio-level asset allocation.
Qualitative depth also varies. The service is strongest at systematically organizing data, checks, risks, and narratives. It does not provide an analyst-written initiation report on every company. Community narratives can add perspective, but user-created content should be treated as opinion and checked for disclosed holdings and assumptions.
Trial, refund, and support terms
Simply Wall St’s terms say new users may request a trial of up to 30 days, limited to one trial per household per 12 months and subject to approval. The same terms state a 14-day money-back guarantee for new subscribers, with later refunds at the company’s discretion. Cancellations stop future renewal but do not generally create a partial refund. Paid subscriptions renew automatically until cancelled.
Customer Service scores 3.8/5. The help center is extensive and provides step-by-step explanations of data, calculations, limits, billing, and portfolio workflows. The score is capped because DollarScout did not send support cases or measure response times, and because much of the product requires self-service interpretation. Users who need human investment guidance should not confuse technical support with financial advice.
A disciplined research workflow
Start with the snowflake to locate unusual strengths or risks. Then open the detailed checks and identify the underlying metric. Verify the as-of date and whether the value is reported, calculated, or forecast. Compare the result with the company’s latest filing and investor presentation. Rebuild the key valuation under conservative assumptions. Finally, document what evidence would change the thesis.
For screening, avoid stacking so many filters that the result merely describes past winners. Begin with a broad economic requirement—positive free cash flow, manageable leverage, or a specific profitability threshold—then inspect whether accounting quirks or sector structure make the filter inappropriate. A bank and a software company should not be judged through identical balance-sheet rules.
Alternatives
Choose Morningstar Investor for deeper fund and ETF comparison, proprietary manager research, and portfolio overlap analysis. Choose Seeking Alpha Premium for competing written theses, earnings transcripts, and quant ratings. Choose Yahoo Finance Silver or Gold for a familiar news-and-watchlist workflow with third-party research, advanced charts, and downloadable data by tier. Use SEC EDGAR and issuer filings when primary disclosure is the main requirement.
Simply Wall St is the best of these for visual orientation. It is not automatically the best for qualitative research, full portfolio construction, or every asset class.
Bottom line
Simply Wall St earns 4.2/5. It makes fundamental research easier to enter without hiding that the analysis is model-driven. The report structure, global equity coverage, S&P Global data, portfolio tools, and official methodology documentation create a useful research system at a fair annual price.
Its central strength can also become its central risk: an elegant graphic may feel more definitive than the forecast behind it. Use the snowflake to decide where to dig, not what to buy. Check the selected plan’s capacity, verify the checkout currency and renewal, and reconcile every material output with current filings and your own assumptions.