Many products on this page are from partners who compensate us. This doesn't influence our ratings. Our opinions are our own.
How to Read an Earnings Report
By Sophie Brown, Senior Finance Editor · Updated Jul 2026 · Fact-checked Jul 18, 2026
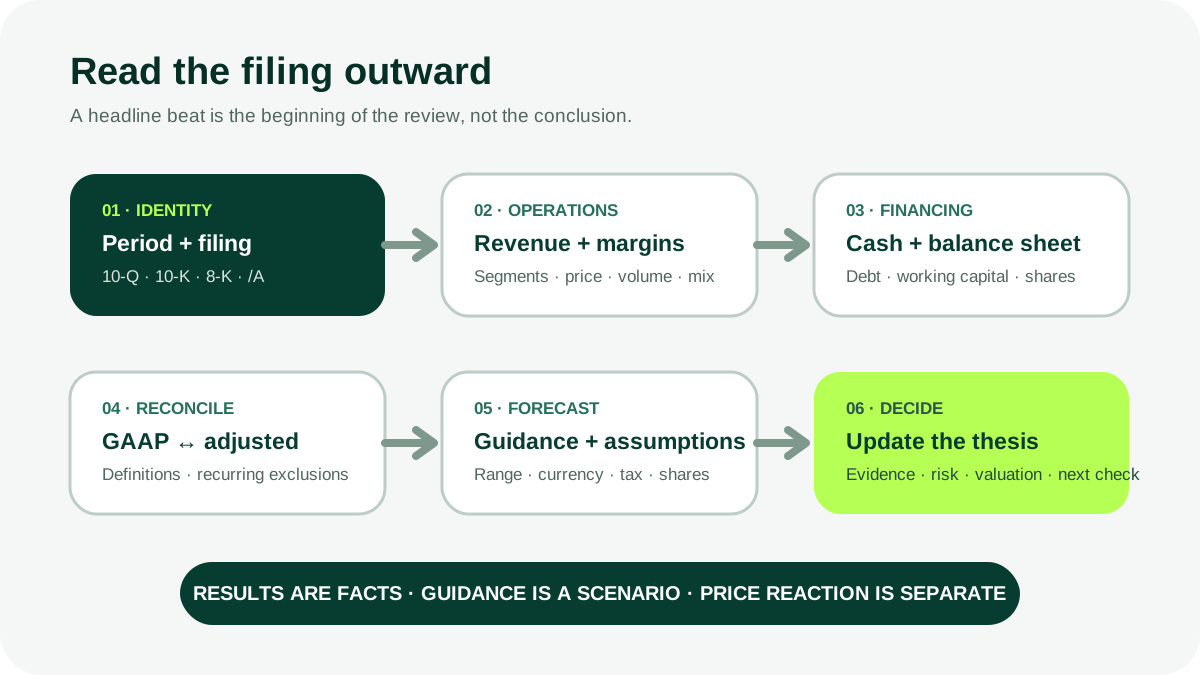
An earnings release is management’s fast summary of a quarter; it is not the complete financial record. A careful reader connects the release and presentation to the 10-Q or 10-K, cash-flow statement, notes, non-GAAP reconciliations, guidance assumptions, and recent 8-K filings. This guide provides a repeatable order for reading results so a headline earnings beat does not obscure weakening cash, dilution, debt, or a changed definition.
Key takeaways
- Confirm the period, filing status, share basis, and accounting framework before comparing any number.
- Read revenue, margins, operating income, cash flow, balance sheet, and share count together; EPS alone is incomplete.
- Reconcile every material adjusted metric to GAAP and check whether “one-time” exclusions recur.
- Separate reported results from guidance, analyst estimates, and management commentary—they carry different evidence.
- Update a written thesis with filing facts and risks rather than reacting only to the stock’s after-hours move.
Gather the complete earnings package
Start at the company’s investor-relations page, then verify documents in SEC EDGAR. A typical quarterly package may include an earnings release furnished with an 8-K, presentation slides, supplemental tables, a webcast, and a later 10-Q. The annual cycle normally includes a 10-K with audited statements.
Record the fiscal quarter, period end, release date, filing date, and whether results are audited. Fiscal years do not always match calendar years. A “fourth-quarter” release may contain full-year figures that cannot be compared directly with a three-month column.
Read the release for orientation, not conclusion
Use the release to locate the company’s chosen highlights, reported GAAP results, adjusted results, segment data, and guidance. Note the order and language. “Record revenue” can coexist with shrinking margins, negative cash flow, acquisition spending, or a larger share count.
Create two columns: facts reported for the completed period and claims or forecasts about the future. A statement such as “demand remains strong” is management commentary until supported by orders, backlog quality, customer retention, pricing, or another disclosed measure.
Do not treat an earnings “beat” as an accounting category. The comparison usually comes from analyst consensus, which can change before release and may use adjusted metrics. Compare actual performance with the company’s prior guidance, your written assumptions, the prior period, and economically comparable peers.
Verify the primary filing in EDGAR
Investor.gov explains that a 10-Q provides unaudited quarterly statements, risk updates, and management discussion; a 10-K provides audited annual statements, risk factors, and MD&A; an 8-K reports specified material events. Read amendments marked /A and check nearby filings for acquisitions, debt, leadership changes, restatements, or auditor events.
The filing matters because the glossy release can condense footnotes and segment details. Use document search for:
- revenue recognition;
- concentration and major customers;
- debt and covenants;
- stock-based compensation;
- restructuring;
- goodwill and impairment;
- legal proceedings;
- related parties;
- subsequent events;
- internal-control weaknesses.
Build a revenue bridge
Start with reported revenue and quantify the change from the comparable period. Separate organic growth from acquisitions, divestitures, currency translation, price, volume, product mix, and accounting changes when disclosed.
Ask whether growth produced cash and whether it is repeatable. Subscription billings, bookings, backlog, same-store sales, units, users, or remaining performance obligations can be useful operating measures, but definitions vary. Read the definition, exclusions, and period. A rising backlog is less useful if cancellation rights, acquisition effects, or delivery constraints changed.
For businesses with segments, calculate each segment’s growth and margin contribution. Consolidated growth can hide decline in the core business or dependence on one customer, geography, or product.
Trace margins and operating expenses
Calculate gross margin, operating margin, and net margin from GAAP statements. Compare both percentage and dollar changes. A margin decline can come from discounting, input costs, product mix, underused capacity, launch expense, acquisition accounting, or a structural shift.
Then inspect operating expenses by function: research and development, sales and marketing, general and administrative, and other categories. Ask whether slower expense growth reflects genuine efficiency or temporary hiring delays and deferred investment.
| Change | Question to investigate |
|---|---|
| Revenue up, gross margin down | Is growth being purchased with discounting or lower-quality mix? |
| Operating margin up, R&D down | Is efficiency sustainable or is future product investment being reduced? |
| Net income up, operating income flat | Did interest, tax, investment gains, or another non-operating item drive it? |
| EPS up, net income flat | Did repurchases reduce weighted-average shares? |
| Adjusted profit up, GAAP loss persists | Which exclusions create the gap, and do they recur? |
Read all three core statements together
The income statement measures revenue and expenses over a period. The balance sheet reports assets, liabilities, and equity at a date. The cash-flow statement explains changes in cash through operating, investing, and financing activities. The SEC’s financial-statement guide emphasizes reading the statements and notes as a connected system.
Income statement
Review revenue, cost of revenue, operating expenses, operating income, interest, taxes, net income attributable to common shareholders, and basic and diluted EPS. Confirm whether profitable companies show dilution from options or convertible securities.
Balance sheet
Compare cash, receivables, inventory, deferred revenue, debt, lease liabilities, goodwill, and equity. Rapid receivable growth relative to sales can signal collection timing or revenue-quality questions. Inventory growth can reflect preparation for demand or unsold product. Goodwill can make acquisition risk important even though it is not a cash outflow this quarter.
Cash-flow statement
Begin with cash from operations, then inspect the reconciliation from net income. Track receivables, inventory, payables, deferred revenue, stock compensation, and other working-capital changes. Capital expenditures appear in investing cash flow. Financing shows debt, share issuance, repurchases, and dividends.
“Free cash flow” is generally a non-GAAP measure and companies can define it differently. Recalculate the company’s definition and compare it with operating cash flow less capital expenditures. Do not ignore acquisition spending, finance leases, or recurring stock compensation simply because the chosen metric excludes them.
Inspect EPS and the share count
Investor.gov defines EPS as net profit divided by common shares. Filings normally present basic and diluted weighted-average shares. Compare diluted shares year over year and with period-end shares.
A company can increase total EPS by repurchasing stock even when total profit is unchanged. Repurchases create value only if the price and financing are sensible; issuing shares for compensation or acquisitions can offset them. Review the statement of equity and proxy materials, not only the EPS headline.
If earnings are negative, diluted securities may be excluded as anti-dilutive. A future return to profit can reveal dilution not visible in current diluted EPS.
Reconcile non-GAAP measures line by line
Companies often present adjusted EBITDA, adjusted operating income, adjusted EPS, or free cash flow. SEC guidance requires appropriate GAAP comparison and reconciliation for covered non-GAAP disclosures. The label does not make the metric standardized.
For every adjusted measure:
- Identify the nearest GAAP measure.
- List each adjustment and tax effect.
- Compare the definition with prior periods.
- Mark exclusions that recur, such as stock compensation, restructuring, or acquisition expense.
- Compare definitions across peers before using a multiple.
A measure may be useful for one question without replacing GAAP. EBITDA can help compare operating performance before financing and certain noncash charges, but it does not fund capital expenditures, working capital, taxes, or debt repayment.
Evaluate guidance as a scenario
Record guidance range, units, currency assumptions, acquisition effects, tax rate, share count, capital spending, and whether the measure is GAAP or adjusted. Compare the new range with prior guidance and actual year-to-date results.
Translate full-year guidance into an implied remaining-period range. If the first half is complete, subtract reported results from the full-year endpoints. This reveals the acceleration or deceleration management expects.
Do not mechanically value the midpoint. Build cases around the range and the risks disclosed. Guidance can exclude acquisitions, currency moves, litigation, or adjustments that later matter.
Read the call and transcript critically
The prepared remarks often repeat the release. The question-and-answer section can reveal pricing, demand, customer budgets, capacity, hiring, and capital allocation. Compare answers with filings and prior statements.
Listen for changed definitions, avoided questions, unusual dependence on “second-half” improvement, or claims that contradict working-capital data. Tone is not a financial metric, and transcript summaries generated by third parties or AI can omit qualifiers. Verify material language in the company webcast, transcript, or filing.
Update the thesis and monitoring sheet
Use a consistent template:
- reported period and filing links;
- revenue bridge and segment performance;
- GAAP margins and cash conversion;
- debt, liquidity, and share-count changes;
- non-GAAP reconciliation concerns;
- guidance and implied future period;
- thesis evidence, disconfirming evidence, and next milestone;
- valuation range under updated scenarios.
Price reaction is a separate field. A stock can fall after strong results because expectations were higher or rise after weak results because the outcome was less bad than feared. The market move does not change what the filing says.
Bottom line
Read an earnings report from the filing outward: verify the period, connect revenue and margins to cash and the balance sheet, inspect dilution and debt, reconcile adjusted metrics, and convert guidance into explicit assumptions. The goal is not to predict the next-day move; it is to update an evidence-based view of the business and the price paid for it.
Related content
Frequently asked questions
Sources
Related content
More from DollarScout on this topic.
